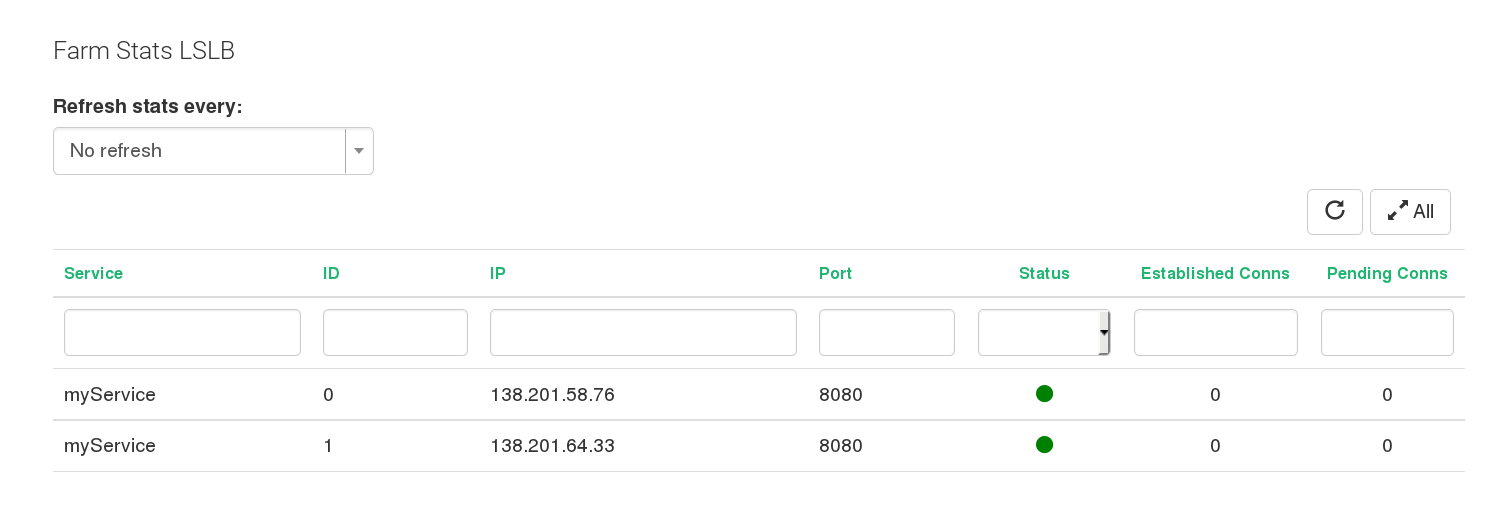
This section shows a table of established and pending connections per backend.
The different fields of the backend connections stats are:
- SERVICE. Farm service name referred.
- ID. Index of the service backend.
- IP. IP address of the backend.
- PORT. PORT of the backend.
- STATUS. Current status of the backend.
- ESTABLISHED CONNS. Number of current established connections to the given backend.
- PENDING CONNS. Number of current pending connections to the given backend.
Color codes for the status of the backends could be one from the next list:
- Green bullet = Means Backend is running normally.
- Orange bullet = Means the Backend is on maintenace mode.
- Red bullet = Means the farm is up but the backend is not reachable.
- Gray bullet = When the farm is stopped and the backend is not on maintenance mode the real backend status remains unknown until the farm is started and the the check is execucted.
The statistics in this section is a freezed sample of the information shown for the current farm. The values shown correspond to the moment of the load of the page. It is also possible to configure an automatic refresh of the page every 10, 30, 60 and 120 seconds. For this purpose there is a select box at the left top of the page.
Also if the farm is an instance of a HTTP profile, an additional table will show listing the sessions established and showing the client IP and the backend serving the requests of such session.
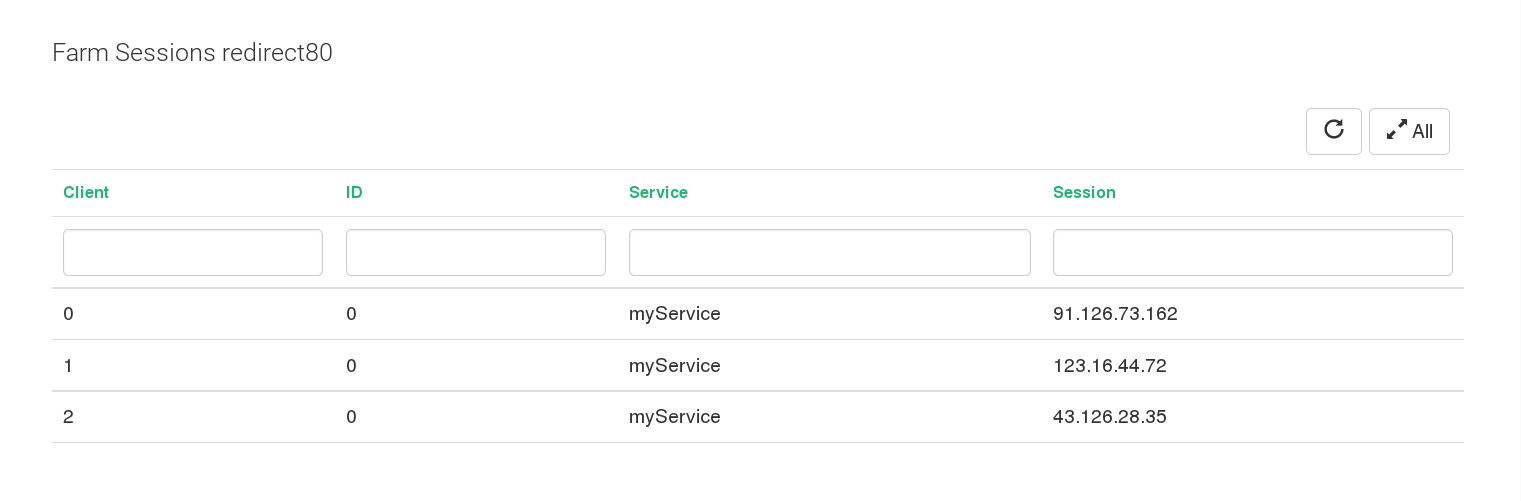
The different fields of the backend sessions stats are:
- CLIENT. Client table sessions index.
- ID. Farm backend index associated to the client.
- SERVICE. Farm service name associated to the client session.
- SESSIONID. Client IP address associated with the backend.
Notice that this last screenshot does not appear if the farm profile is L4xNAT
Comments