This section shows a table including the number of established and pending connections found for every GSLB farm. The number of connections shown are about the current stats in a certain instant.
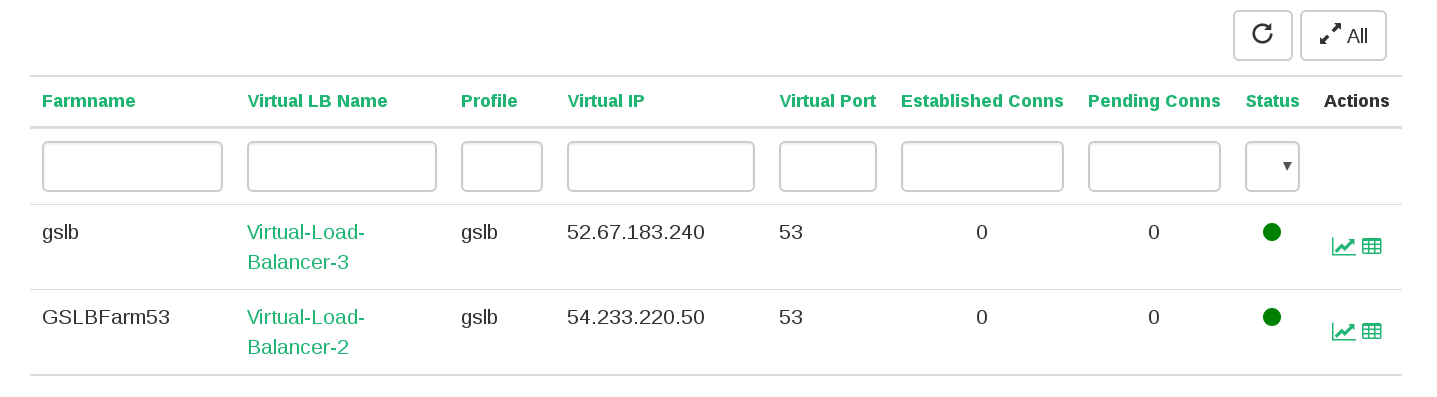
This table includes the following columns:
- Farm name. Name of the virtual service or farm related.
- Virtual LB Name. The Virtual Load Balancer running the farm.
- Profile. Nature or type of load balancing used in this GSLB farm, commonly gslb.
- Virtual IP. IP address used by the virtual service to handle requests.
- Virtual Port. Ports used by the virtual service to wait for requests.
- Established Conns. Connections marked as ESTABLISHED.
- Pending Conns. Connections marked as SYN. An increasing value means a higher rate of requests received that can’t be served.
- Status. This shows the state of the farm system process with a green dot if the farm is up, a red dot if the farm is down, a yellow dot if the farm needs to apply changes.
- Actions. This column has two links for every farm, a link to Show graphs and a link to Show backend stats.
Each of those columns may be used to filter the table by a given field. Use the blank rectangles on the top for this purpose.
By default the statistics will show a single sample of the connections found for GSLB farms, but it is also possible to refresh the data every 10, 30, 60 and 120 seconds.
Comments