Dashboard
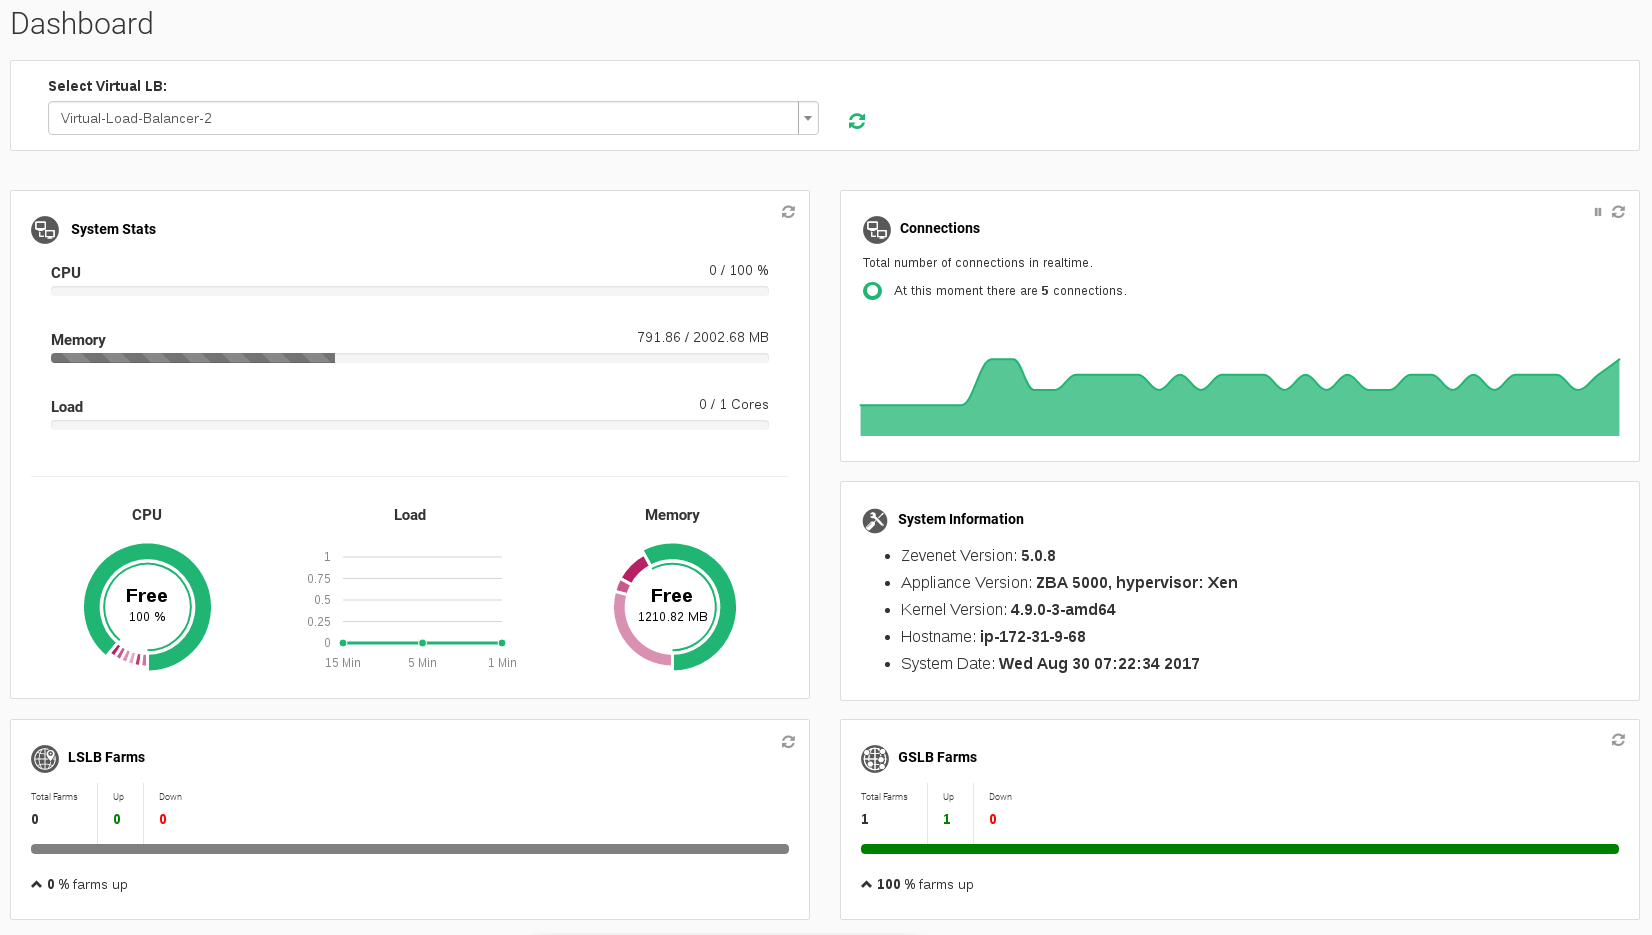
This section shows the current whole status of a Zevenet load balancer appliance: CPU usage, memory, load, connections, system information, farms status, interfaces configured, status and consumption. The dashboard is distributed in: System Stats, Farms report and network interfaces stats.

In the upper left corner you may select which Virtual Load Balancer you would like to be shown in the Dashboard. Use the selection box for this purpose whenever you need it.

System Status
The top side of the Dashboard will show in graphics the current resources usage.
In order to refresh the graphs, please click in the refresh button in the top right of the graph.
CPU Usage
- Free. % without usage.
- User. % used that is being used by normal processes in user space. Example: HTTP/S load balancer cores, administration web server, etc.
- Nice. Usage of prioritized processes in the system.
- System. Usage of kernel space processes. Example: L4 farms, network drivers, etc.
- Iowait. Usage of I/O tasks like disk or networking.
- Irq. Usage of interrupts to the main CPU.
- Softirq. Usage of serving software interrupts.
Memory Usage
- Free. Memory available in the system.
- Used. Memory not available and used by the kernel and processes in the system.
- Cached. Memory allocated but not currently used by any process.
- Buffers. Memory used by buffers in the system.
Load Usage
Indicates the number of cores loaded and the history and progression of the load in the whole appliance during the last minute, last 5 minutes and last 15 minutes.
Connections Graph
Real time connections graph that is supporting the whole appliance. In the top right of the graph it’s available a pause and refresh button.
System Information
Basic information related with the appliance: Zevenet Version, Appliance version and hypervisor, kernel version, hostname and system date.
Farms Info
For every type of Load Balancing Service summarizes the number of total, available or down farms services.

Comments